Can you combine data from several business tools?
Yes. We can assess the sources and create a reporting approach that reduces manual collection and gives teams a more consistent view of important measures.
Data and analytics
Turn fragmented reports and spreadsheets into a reliable view of the numbers your team needs to understand, act on and share.
Built for a real business need
A dashboard is only as useful as the decisions it supports. We help identify the questions leaders and teams need to answer, improve the quality of the underlying data and present the important signals without unnecessary noise.
Get a free first consultation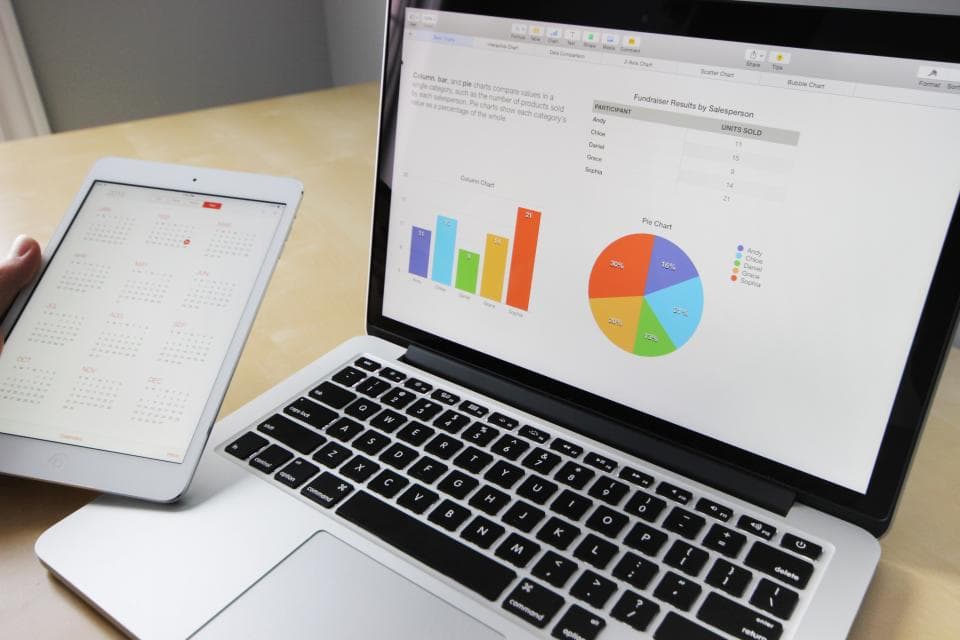
What you get
Live dashboards with exactly the numbers you care about, refreshed automatically and easy to read.
How we work
We trace where each measure comes from, agree on definitions, clean up the data flow and design practical dashboards and reports. As the business changes, the reporting can change with it.
Related technology services
Frequently asked questions
Yes. We can assess the sources and create a reporting approach that reduces manual collection and gives teams a more consistent view of important measures.
Examples include sales, operations, inventory, finance, service and management dashboards. The metrics are chosen around the decisions the users need to make.
Yes. We can trace the source of conflicting figures, clarify definitions and improve the data flow before building a new reporting layer.
Tell us what is getting in the way. We will come back with practical next steps, a timeline and an honest estimate.